2. Methodology
This paper provides an overview of how the various EOR methodologies affected the experimental reservoir. The sample data acquired was modeled with CMG Reservoir Simulation Software and simulated with Petroleum Expert’s MBAL Simulator to predict the future performance of the field. The EOR methods to be discussed encompass Thermal, Chemical, and CO2 Gas Injection techniques, each tailored to a common reservoir conditions and fluid properties to optimize oil recovery rates of the experimental reservoir.
2.1. Data After Primary Production
Reservoir Parameters
1) Reservoir Length: 1000 feet
2) Reservoir Width: 100 feet
3) Reservoir Height: 20 feet
4) Oil-Water Contact: 50 feet
5) Dip Angle: 0 degrees
6) Permeability: 100 md
7) Porosity: 25%
8) Connate Water Saturation: 25%
9) Cut-Off Water Cut: 99%
10) Reservoir Pressure: 2000 psi
Fluid Parameters
1) Oil Density: 50.0 lb/ft³
2) Oil Viscosity: 5.0 cP (centipoise)
3) Oil Formation Volume Factor (FVF): 1.05 RB/STB
4) Water Density: 60.0 lb/ft³
5) Water Viscosity: 1.0 cP (centipoise)
6) Water Formation Volume Factor (FVF): 1.0 RB/STB
Injected Fluid Parameters
1) Injected Fluid Rate: 200 STB/day
Relative Permeability (Corey Function)
1) Residual Saturation of Relative Permeability of Water (Swc): 20%
2) Residual Saturation of Relative Permeability of Oil (Sor): 30%
3) Endpoint of Relative Permeability of Water (krw max): 0.5
4) Endpoint of Relative Permeability of Oil (kro max): 0.5
5) Exponent of Relative Permeability of Water (nw): 2.0
6) Exponent of Relative Permeability of Oil (no): 2.0
2.2. Modelling
Data in
Figure 4 was used to develop a comprehensive model of the reservoir, ensuring that it accurately represents the reservoir's physical and geological properties. This model served as the foundation for simulating various reservoir behaviors and scenarios, allowing for a thorough analysis of its performance under different conditions. By integrating the data into the simulation, the researchers were able to predict the reservoir's response to various injection and production strategies, thereby providing valuable insights for optimizing reservoir management and enhancing oil recovery.
2.2.1. Procedure for Modelling with CMG
1) The Reservoir Model:
a) Opened CMG Builder and created a new project.
b) Defined the reservoir grid by setting the dimensions (number of cells in X, Y, Z directions), and specifying the grid size to capture the reservoir's heterogeneity.
2) Assigning Reservoir Properties:
a) Imported and assigned petrophysical properties (porosity, permeability, net-to-gross ratio) to the reservoir grid.
b) Entered fluid properties such as PVT (Pressure-Volume-Temperature) data for oil, gas, and water phases.
c) Defined relative permeability and capillary pressure curves to model multiphase flow behavior.
3) Setting Initial Conditions:
a) Specified the initial pressure distribution and temperature across the reservoir.
b) Defined initial saturations of oil, gas, and water based on reservoir data.
4) Defined Boundary Conditions and Wells:
a) Set up boundary conditions to represent external influences on the reservoir (e.g., constant pressure or no-flow boundaries).
b) Entered well locations, trajectories, and completion details, including perforation intervals and well types (producers/injectors).
c) Specified well controls such as production rates, injection rates, or bottom-hole pressures.
5) Running the Simulation and documentation:
a) Executed the simulation by running the CMG simulator.
b) Monitored the simulation progress and ensured there were no errors or issues during the run. Documented the modelling and simulation process, including key assumptions, model parameters, and results.
2.2.2. Simulation
Data listed in
Figure 5 were used to simulate enhanced oil recovery (EOR) methods using MBAL software. This tool will allow the researcher to model the reservoir's response to various EOR techniques, including Water Flooding, Thermal Injection, Chemical Injection, and CO
2 Gas Injection, by inputting the collected data into the software. MBAL helped analyze the effects of these methods on reservoir performance, including production rates and overall recovery efficiency. By simulating different EOR scenarios, we identified the most effective strategies to maximise oil recovery and optimise the reservoir's production potential.
2.2.3. Procedure for Simulating with MBAL
1) Data Collection and Preparation:
2) Entered Data into MBAL:
a) Opened MBAL and created a new project.
b) Entered the reservoir data into the software, including PVT data, reservoir properties, and historical production data.
c) Defined the reservoir’s initial conditions, such as initial pressure, oil saturation, and water saturation.
3) Model Setup:
a) Choose the appropriate EOR method(s) to simulate (e.g., waterflooding, gas injection, chemical EOR).
b) Set up the model by specifying the EOR parameters, such as injection rates, fluid properties of the injected substance, and the timing of the EOR process.
4) Run the Simulation:
a) Simulate to model the reservoir’s response to the chosen EOR method(s).
b) Monitored key variables like pressure, oil production rate, and recovery factor throughout the simulation.
2.3. Model of the Reservoir
The experimental reservoir is modelled to in CMG to produce a graphical representation of the reservoir based on its properties as well as properties of the fluids it contains. The production structure of the reservoir includes one production well and one injection well.
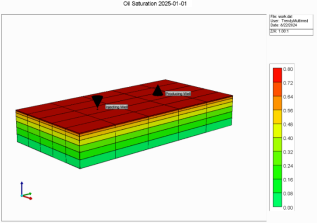
Figure 1. Experimental Reservoir model showing oil saturation.
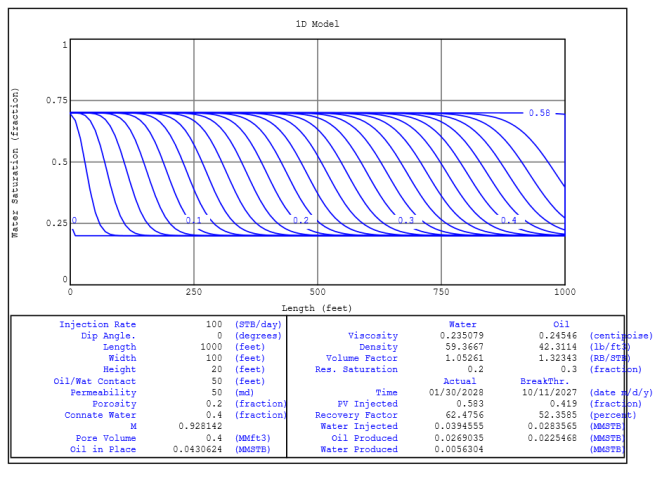
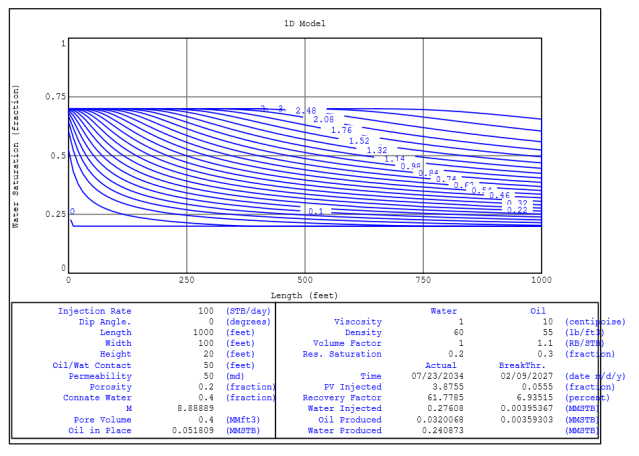
Figure 1 shows a model of the experimental reservoir representing oil saturation to understand the distribution and behaviour of oil within a reservoir before secondary production. Oil saturation refers to the proportion of the pore space within the reservoir rock that is occupied by oil, expressed as a percentage. In the model, oil saturation is typically mapped throughout the reservoir, providing a spatial representation that shows how oil is distributed across different regions. This distribution is influenced by various factors, including the reservoir’s geology, the properties of the fluids present, and the reservoir’s production history. It can be determined that oil is more saturated at the top of the reservoir and decreases as it goes down the reservoir. This happens because water is denser than oil and will settle at the bottom. Engineers can identify areas with high residual oil that may benefit from targeted EOR techniques, optimize recovery strategies, and predict future production trends. This detailed understanding of oil saturation distribution is essential for making informed decisions about reservoir management and maximizing oil recovery.
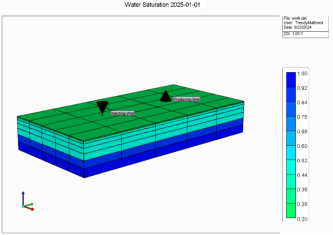
Figure 2. Experimental Reservoir model showing water saturation.
Figure 2 shows a model of the experimental reservoir showcasing the distribution and behaviour of water within a reservoir before secondary production. Water is highly concentrated at the bottom of the reservoir as a result of its higher density as compared to oil, and the saturation of water decreases in the reservoir.
Figure 3. Model of an experimental reservoir showing both vertical injection and deviated production wells.
Figure 3. Model of experimental reservoir showing both vertical injection and deviated production wells.
2.3.1. Simulation of Secondary Production
Water injection simulation of the data in
Figure 3 with MBAL (from the Petroleum Expert IPM suite) predicted the future performance of the reservoir. The simulation predicted the amount of oil to be recovered, cumulative water produced, and other relevant information.
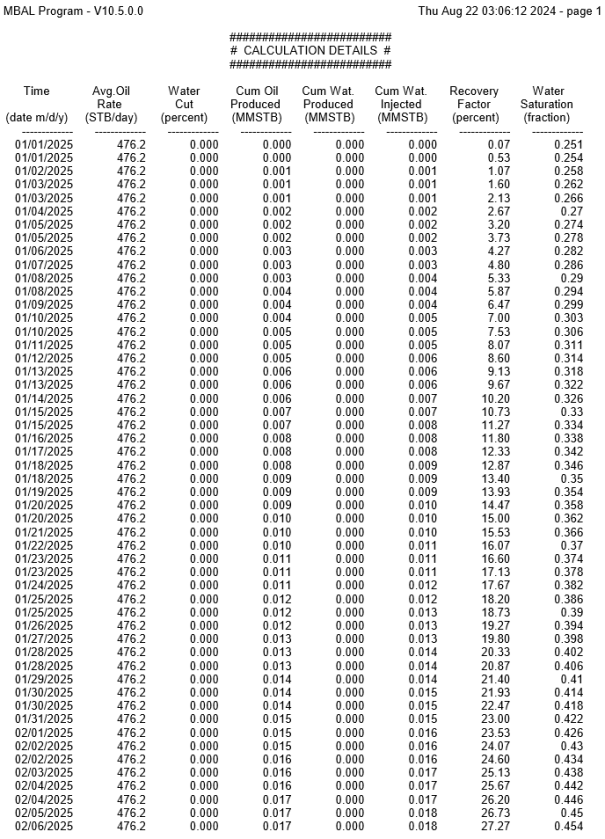
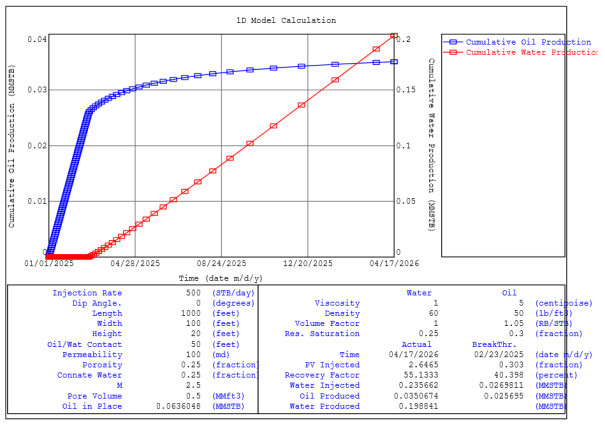
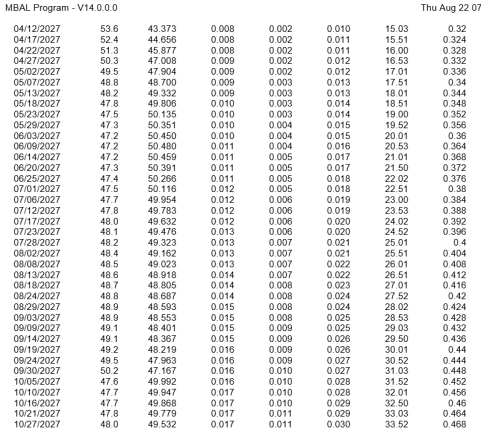
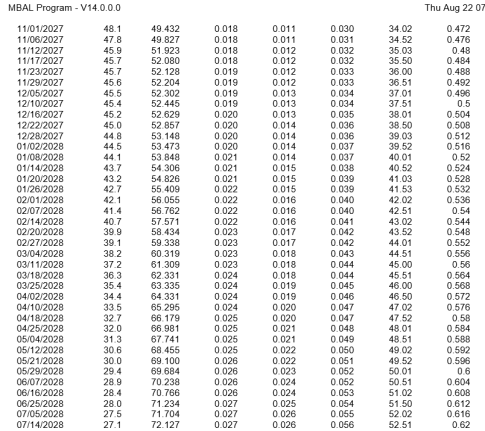
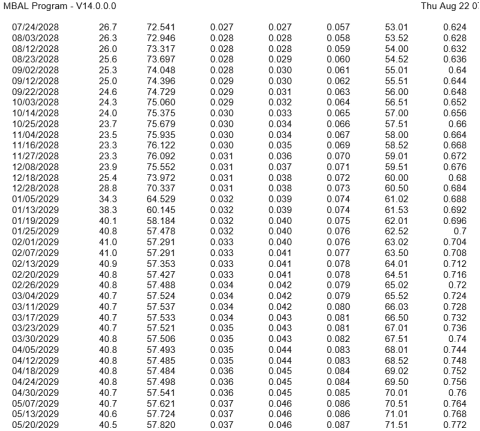
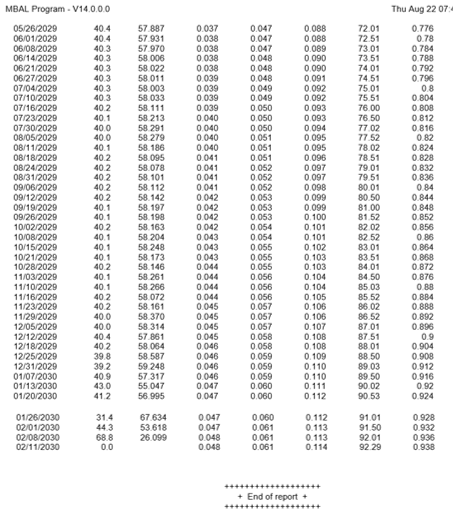
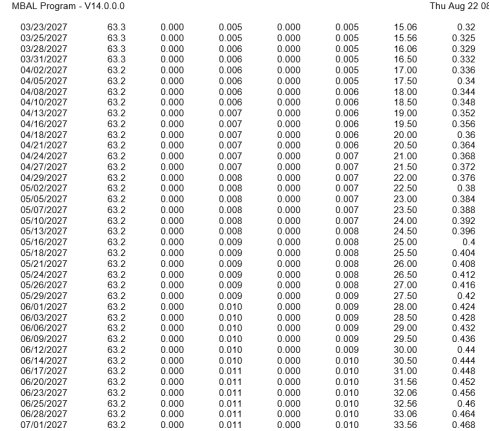
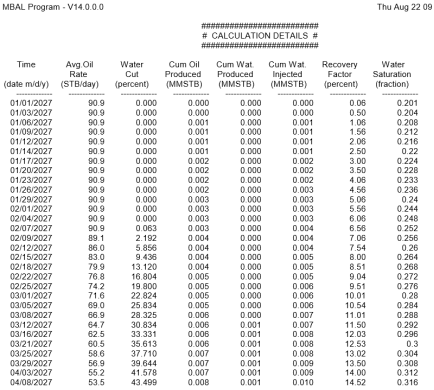
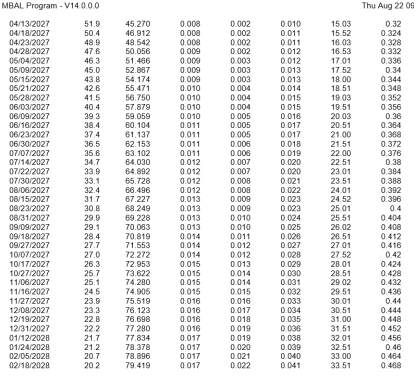
Figures 4 to 5 shows the calculated results of the water injection process, which highlights the performance indicators such as cumulative oil and water produced, recovery factor, and water cut, as well as other relevant factors. Cumulative oil produced is the total amount of oil produced during the simulation period, providing evidence of the effectiveness of the water injected in displacing oil towards the production well. Cumulative water produced, on the other hand, is the amount of water produced alongside oil. The recovery factor, defined as the ratio of the amount of oil recovered to the total amount of oil initially in place, serves as a key indicator of the success of the injection process. As water is injected into the reservoir, it displaces the oil towards the production wells, increasing the overall recovery. The simulation typically reveals a gradual increase in the recovery factor over time, indicating improved oil extraction. However, the effectiveness of this process is influenced by various factors such as reservoir heterogeneity, water injection rate, and fluid properties, shown in
Figure 6 graph of water injection simulation showing cumulative oil produced and cumulative water produced over. In scenarios where these factors are optimised, the simulation shows a higher recovery factor, reflecting efficient oil displacement and better reservoir management. It can be determined from
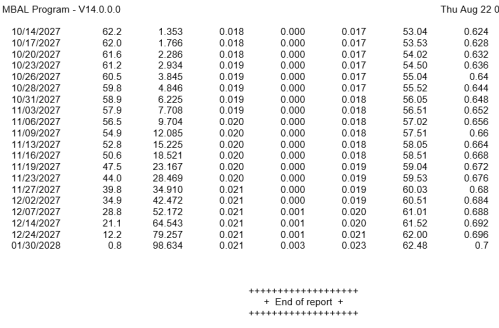
Figures 9 to 13 that on 2/27/25, water production of water began. This point is called the breakthrough.
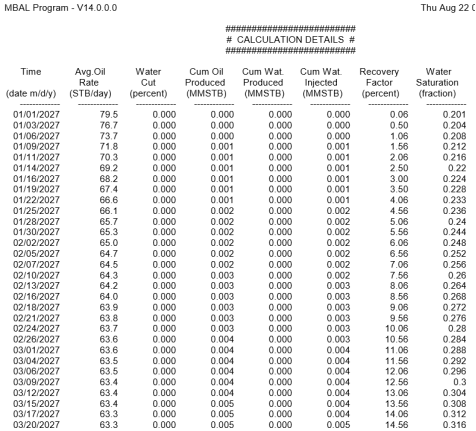
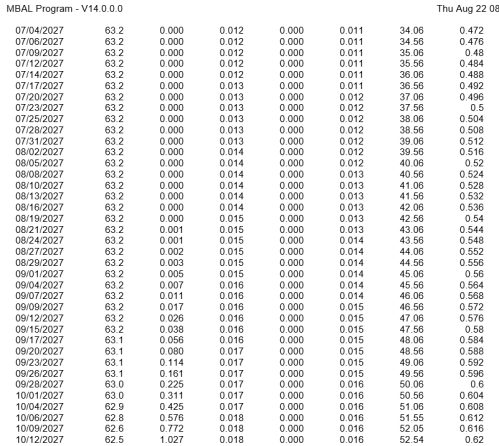
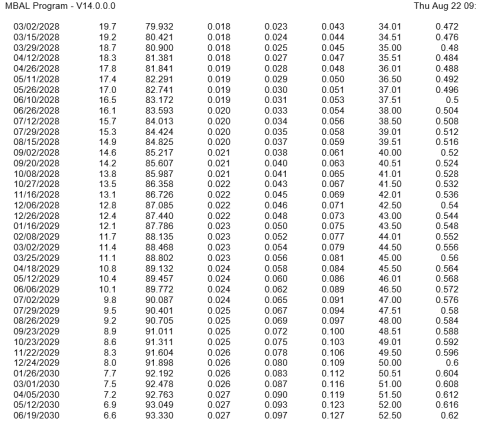
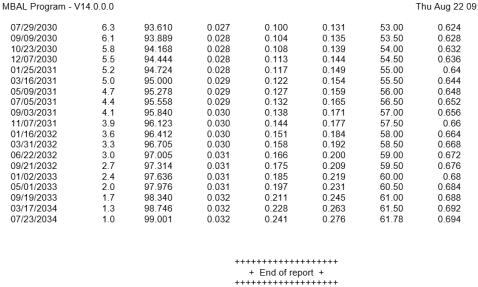
Figure 4. A table of the results of the simulated water injection process (Continue on next page).
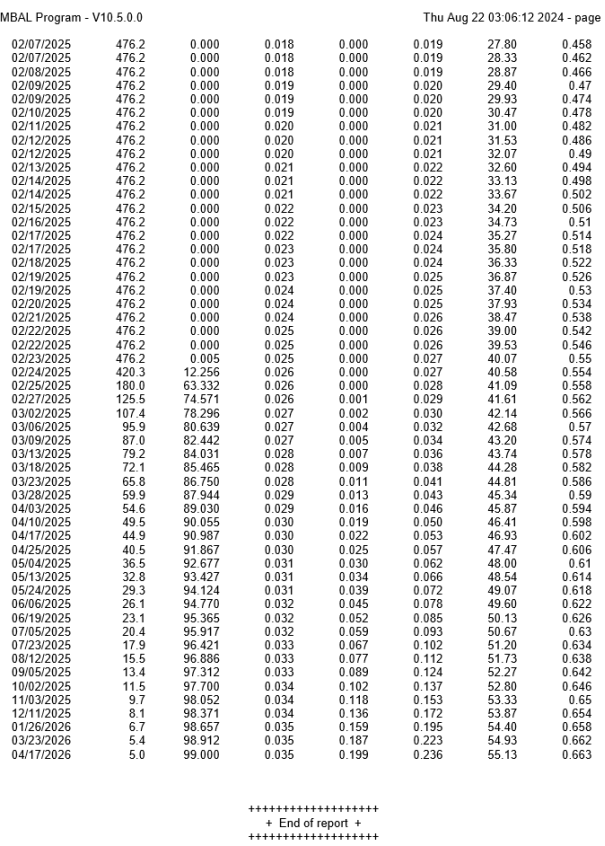
Figure 5. A table of the results of the simulated water injection process.
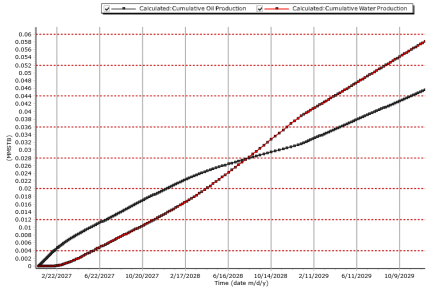
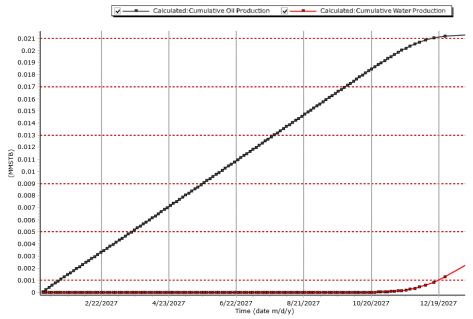
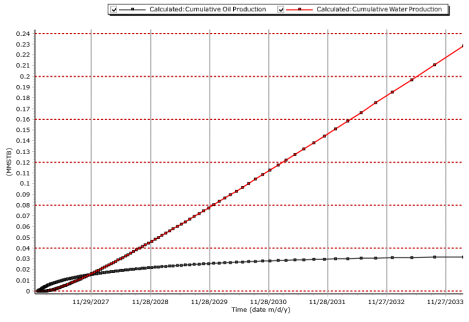
Figure 6. Graph of water injection simulation showing cumulative oil produced and cumulative water produced over time.
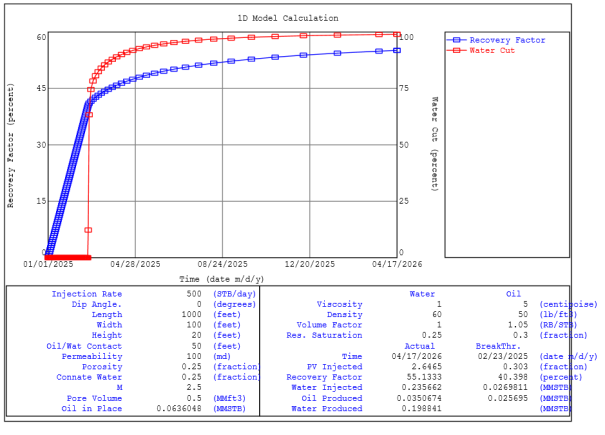
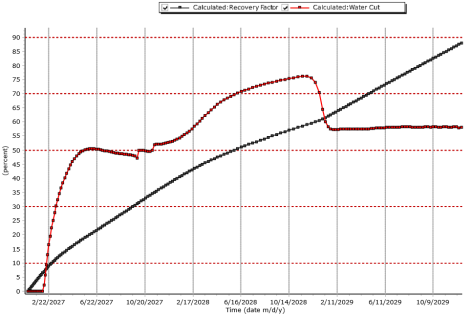
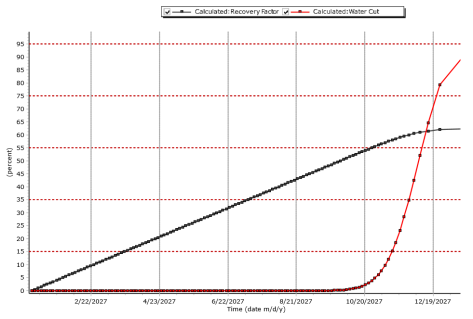
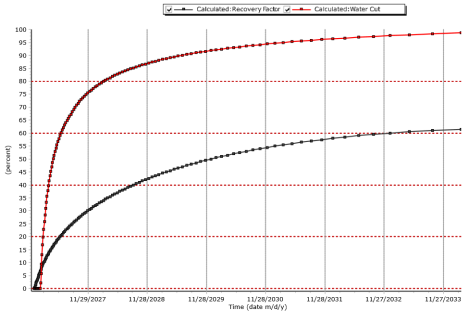
Figure 7. Graph of water injection simulation showing recovery factor and water cut over time.
Figure 6 shows a graph depicting cumulative oil and water production over time following a water injection simulation. This illustrates the dynamic response of the reservoir to the injection process. Initially, the cumulative oil production increases at a steady rate as water injection helps to displace the oil towards the production wells. However, as the simulation progresses, the cumulative water production begins to rise, reflecting the breakthrough of injected water into the production stream. This increase in water production is often accompanied by a tapering off in the rate of oil production, as water increasingly occupies the pore spaces within the reservoir. The separation between the oil and water production curves indicates the effectiveness of the waterflood, with a smaller gap suggesting higher water cut and reduced oil recovery efficiency. Over time, the cumulative oil production curve tends to plateau, while the cumulative water production continues to climb, highlighting the challenge of maintaining oil recovery as water encroachment becomes more dominant.
Figure 7 shows a graph depicting water cut and recovery factor over time following a water injection simulation, which illustrates the dynamic interplay between water production and oil recovery during the flooding process. Initially, the water cut is low, reflecting a predominance of oil in the produced fluids as the injected water has yet to reach the production wells. Over time, as water continues to be injected and displaces the oil, the water cut gradually increases, indicating that a larger proportion of water is being produced alongside the oil. Concurrently, the recovery factor shows a steady rise, demonstrating that more oil is being recovered from the reservoir. At early stages, the recovery factor climbs rapidly as easily displaceable oil is produced. However, as the water cut continues to rise, the rate of increase in the recovery factor begins to taper off, signalling that oil recovery is becoming less efficient as more water and less oil are being produced. This graph is crucial for understanding the efficiency and limits of the water flooding process, helping to optimise injection strategies and improve oil recovery.
2.3.2. Enhanced Oil Recovery Simulation
Updated Reservoir Parameters after Secondary Production (Matured field):
1) Reservoir Length: 1000 feet
2) Reservoir Width: 100 feet
3) Reservoir Height: 20 feet
4) Oil-Water Contact: 50 feet
5) Dip Angle: 0 degrees
6) Permeability: 50 md (reduced, indicating reservoir damage or depletion)
7) Porosity: 20% (reduced, which reflects compaction)
8) Connate Water Saturation: 40% (increased, reflecting more water in the reservoir)
9) Cut-Off Water Cut: 99%
10) Reservoir Pressure: 1000 psi (reduced, typical of a depleted reservoir)
11) Grain Density: 1.2 g/cm3
Fluid Parameters:
1) Oil Density: 55.0 lb/ft³ (slightly increased, indicating heavier crude after lighter components have been produced)
2) Oil Viscosity: 10.0 cP (increased, lighter components are produced first, leaving heavier oil behind)
3) Oil Formation Volume Factor (FVF): 1.10 RB/STB (slightly increased, reflecting changes in reservoir conditions)
4) Water Density: 60.0 lb/ft³
5) Water Viscosity: 1.0 cP
6) Water Formation Volume Factor (FVF): 1.0 RB/STB
Injected Fluid Parameters:
1) Injected Fluid Rate: 100 STB/day (unchanged)
1) Relative Permeability (Corey Function):
2) Residual Saturation of Relative Permeability of Water (Swc): 20% (increased, reflecting a more water-saturated reservoir)
3) Residual Saturation of Relative Permeability of Oil (Sor): 30% (increased, indicating more trapped oil)
4) Endpoint of Relative Permeability of Water (krw max): 0.8 (reduced, reflecting reduced mobility of water in the reservoir)
5) Endpoint of Relative Permeability of Oil (kro max): 0.9 (reduced, reflecting reduced oil mobility)
6) Exponent of Relative Permeability of Water (nw): 1.0 (slightly increased)
7) Exponent of Relative Permeability of Oil (no): 1.0 (slightly increased)
2.3.3. Surfactant/ Polymer Injection
EOR Input
Table 1 indicate EOR Input Data for Polymer Concentration, Apparent Viscosity, Surfactant Concentration and Surface Tension.
Table 1. EOR Input Data.
Polymer Concentration (ppm) | Apparent Viscosity (Centipoise) | Surfactant Concentration (ppm) | Surface Tension (dyne/cm) |
10,000 | 5 | 1,000 | 0.1 |
30,000 | 50 | 3,000 | 0.01 |
50,000 | 100 | 50,000 | 0.001 |
Rock Absorption = 0.001 mg/g
Oil Partition Coefficient = 0.001 mg/g
EOR Schedule
Table 2 shows EOR Schedule indicate
PV Injected, Polymer Concentration and Surfactant Concentration.
Table 2. EOR Schedule.
PV Injected | Polymer Concentration (ppm) | PV Injected | Surfactant Concentration (ppm) |
0.2 | 0 | 0.2 | 50, 000 |
100 | 10,000 | 100 | 0 |
3. Results and Discussion After Simulation
Surfactant/Polymer Enhanced Oil Recovery (EOR) is an advanced technique aimed at improving oil recovery by injecting surfactants and polymers into the reservoir. The surfactants reduce the oil-water interfacial tension, making it easier for the trapped oil to be displaced, while polymers increase the viscosity of the injected water, improving sweep efficiency and reducing water channelling. The effectiveness of this method is often evaluated using key metrics like cumulative oil produced, recovery factor, cumulative water produced, and water cut. Cumulative oil produced and recovery factor are crucial indicators of the success of the EOR process, with the recovery factor reflecting the overall efficiency of oil extraction relative to the original oil in place. A successful surfactant/polymer EOR project typically shows a significant increase in cumulative oil produced and a corresponding rise in the recovery factor, as the injected chemicals enhance oil displacement. The cumulative water produced, on the other hand, demonstrates the effectiveness of the surfactant/polymer injection in minimizing water cut and optimizing reservoir performance.
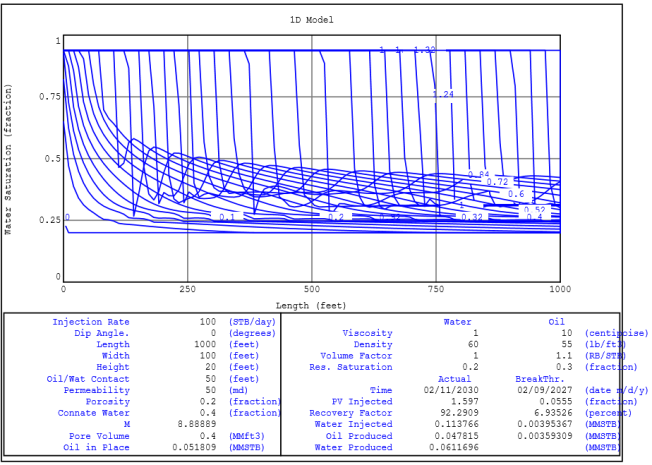
Figure 8. A graph of water saturation to length after surfactant/ polymer EOR.
Figure 8. Above is a graph that shows the saturation of water across the length of the reservoir after surfactant/ polymer EOR. It also displays the results from the simulation after three years. It displays a recovery factor of 92%, 0.047815 MMSTB of oil produced, and 0.061 MMSTB of water produced.
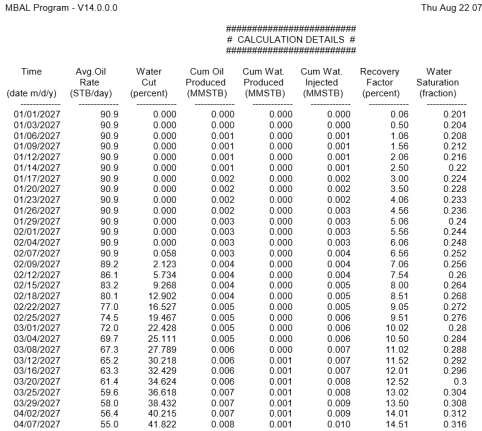
Figure 9. Results of surfactant/ polymer flooding EOR (Continue on next page).
Figure 10. Results of surfactant/ polymer flooding EOR (Continue on next page).
Figure 11. Results of surfactant/ polymer flooding EOR (Continue on next page).
Figure 12. Results of surfactant/ polymer flooding EOR (Continue on next page).
Figure 13. Results of surfactant/ polymer flooding EOR.
Figure 14. Graph of cumulative oil and water production after surfactant/ polymer flooding EOR.
Figure 14 shows a graph showing cumulative oil and water produced against time following surfactant/polymer injection; the trends typically reveal the enhanced oil recovery (EOR) effects of the treatment. Initially, there is an observable increase in the rate of cumulative oil production as the surfactant and polymer work to reduce interfacial tension and improve the sweep efficiency, respectively. This results in more efficient displacement of oil towards the production wells. The cumulative oil curve will typically show a steeper slope compared to pre-injection periods, reflecting the success of the EOR method. Meanwhile, the cumulative water production may also rise, especially if water production was already significant before injection. However, the polymer's role in reducing water mobility might slow the rate of water cut increase, resulting in a more favourable oil-to-water ratio. Over time, as the effects of the surfactant/polymer injection diminish, the slope of the cumulative oil curve may gradually flatten, signalling a decrease in incremental oil recovery. This graph provides a clear visual representation of the effectiveness and duration of the enhanced recovery process achieved through surfactant/polymer injection. At the point of intersection, both curves produced 0.028 MMSTB of oil and water, respectively.
Figure 15. A graph of recovery factor and water cut against time after surfactant/ polymer injection.
Figure 15 shows a graph depicting the recovery factor and water cut against time following surfactant/polymer injection, which provides valuable insights into the enhanced oil recovery (EOR) process. Initially, after the injection of surfactants and polymers, the recovery factor begins to rise more rapidly compared to conventional water flooding, indicating improved oil displacement and mobilization. This is due to the reduction in interfacial tension and the increase in sweep efficiency provided by the surfactant/polymer mixture. Over time, the recovery factor continues to increase, but at a slower rate as the process progresses. Concurrently, the water cut—a measure of the proportion of water in the produced fluids—initially remains low as the injected chemicals help to mobilise trapped oil. However, as the injection progresses, the water cut typically starts to rise, indicating that more water is being produced relative to oil. This increase in water cut is expected as the easily recoverable oil is produced, and the reservoir starts producing more water. The overall trend in the graph illustrates the effectiveness of surfactant/polymer injection in improving oil recovery while also highlighting the inevitable increase in water cut over time as the reservoir matures.
3.1. Hot Water EOR Simulation
Table 3 shows injection data for hot water EOR
Table 3. Injection data for hot water EOR.
PV Injected | Injection Temperature (deg F) |
100 | 1000 |
1) Rock Specific Heat: 0.22 BTU/lb/F
2) Formation GOR: 800 scf/STB
3) Oil Gravity: 44 API
4) Gas Gravity: 0.8 sp. gravity
5) Water Salinity: 14000 ppm
6) Mole Percentage H2S: 0%
7) Mole Percentage CO2: 0%
8) Mole Percentage N2: 0%
9) Reservoir Pressure: 2000 psig
10) Reservoir Temperature: 250 deg F
3.2. Results of Simulation
The results from the hot water enhanced oil recovery (EOR) method indicate significant improvements in both cumulative oil and water production, as well as an increased recovery factor. The cumulative oil production demonstrates a noticeable increase due to the reduction in oil viscosity and improved mobility, allowing for more efficient displacement of oil. Simultaneously, cumulative water production also rises as the injected hot water efficiently sweeps through the reservoir, displacing both oil and water. The recovery factor shows a marked enhancement, reflecting the effectiveness of the hot water injection in mobilizing and recovering additional oil from the reservoir. These results underscore the potential of hot water EOR as a viable method for improving oil recovery in suitable reservoirs.
Figure 16. A graph of water saturation to length after hot water injection EOR.
Figure 16 shows a graph that shows the saturation of water across the length of the reservoir after surfactant/ polymer EOR. It also displays the results from the simulation after three years. It displays a recovery factor of 62%, 0.0269 MMSTB of oil produced, 0.00563 MMSTB of water produced, and
Figures 17 to 20 results of the hot water injection simulation.
Figure 17. Results of hot water injection simulation (Continue on next page).
Figure 18. Results of hot water injection simulation (Continue on next page).
Figure 19. Results of hot water injection simulation (Continue on next page).
Figure 20. Results of hot water injection simulation (Continue on next page).
Figure 21. Graph of cumulative oil and water production against time after hot water injection EOR.
Figure 21 A graph plotting cumulative oil and water production against time following hot water Enhanced Oil Recovery (EOR) injection typically shows distinct trends that highlight the impact of the thermal method on reservoir performance. Initially, there may be a period where cumulative oil production rises gradually, as the injected hot water propagates through the reservoir, reducing oil viscosity and improving mobility. This leads to an accelerated increase in oil production as more oil is displaced towards the production wells. The cumulative water production curve might initially increase at a slower pace but may start to rise more sharply as a breakthrough occurs, and the injected water reaches the production wells. Over time, as the reservoir undergoes continued thermal stimulation, the rate of oil production may stabilise or decline, while water production continues to increase, reflecting the eventual dominance of water in the produced fluids. The separation between the oil and water production curves over time can indicate the efficiency of the EOR process, with a wider gap suggesting better oil recovery before significant water breakthrough.
Figure 22. Graph of recovery factor and water cut against time after hot water injection EOR.
Figure 22 shows a graph plotting water cut and recovery factor against time following hot water Enhanced Oil Recovery (EOR) injection. The water cut typically starts low as the injected hot water primarily displaces oil towards the production wells. Over time, as the reservoir becomes increasingly swept by the injected water, the water cut begins to rise, reflecting the increased production of water relative to oil. This rise in water cut is usually gradual at first, but can accelerate as more of the reservoir is swept. The recovery factor, which represents the cumulative percentage of oil extracted from the reservoir, initially increases steadily as the hot water injection improves oil mobility and displacement efficiency. However, as the water cut continues to rise, the rate of increase in the recovery factor tends to slow down, indicating diminishing returns on additional oil recovery. The overall shape of these curves helps in understanding the effectiveness and longevity of the hot water injection process, providing critical insights into the timing and need for potential adjustments in the EOR strategy.
3.3. Gas Injection (CO2) EOR Simulation
EOR Input
Table 4 shows EOR input data and Table 5 show the EOR schedule data. Table 4. EOR Input data.
CO2 Concentration in Oil | Oil Viscosity Reduction |
0.01 | 0.4 |
0.05 | 0.3 |
0.1 | 0.2 |
EOR Schedule
Table 5. EOR schedule data.
PV Injected | CO2 Concentration in Injected Water |
100 | 0.9 |
Figure 23. Graph of water saturation in the reservoir against length.
Figure 23 shows a graph that displays the results from the simulation after three years. It displays a recovery factor of 61%, 0.032 MMSTB of oil produced, 0.240 MMSTB of water produced, and Mbal data shown in
Figures 24-27.
Figure 24. Results of CO2 gas injection EOR (Continue on next page).
Figure 25. Results of CO2 gas injection EOR (Continue on next page).
Figure 26. Results of CO2 gas injection EOR (Continue on next page).
Figure 27. Results of CO2 gas injection EOR.
Figure 28. Graph of cumulative oil and water produced against time after CO2 injection EOR.
Figure 28 shows a graph plotting cumulative oil and water production against time following CO
2 gas Enhanced Oil Recovery (EOR) injection, which typically shows distinct trends that reflect the impact of CO
2 on reservoir performance. Initially, cumulative oil production may rise sharply as the CO
2 injection enhances oil recovery by reducing oil viscosity and improving its mobility, thereby increasing the displacement efficiency. Over time, the rate of oil production might stabilize or slow down as the CO
2 front progresses through the reservoir and production approaches the economic limit. Simultaneously, cumulative water production often increases at a slower rate initially but may accelerate as the injected CO
2 displaces water towards the production wells. This rise in water production could indicate a breakthrough of CO
2 and the onset of increased water cut, a common occurrence in mature reservoirs undergoing gas injection EOR. The graph provides valuable insights into the timing and effectiveness of the CO
2 injection, highlighting the balance between enhanced oil recovery and the accompanying increase in water production, which are critical for evaluating the economic viability of the EOR process.
Figure 29. Graph of recovery factor and water cut against time after CO2 injection EOR.
Figure 29 A graph plotting water cut and recovery factor against time following CO
2 gas Enhanced Oil Recovery (EOR) injection typically reveals crucial insights into the efficiency and dynamics of the recovery process. Initially, after CO
2 injection begins, the recovery factor generally increases as the injected CO
2 reduces oil viscosity and improves oil displacement, leading to enhanced oil production. During this early phase, the water cut, which represents the ratio of water to the total produced fluids, may remain low as more oil is mobilized and produced. Over time, as the CO
2 continues to displace oil, the recovery factor continues to rise, albeit at a gradually decreasing rate as the process reaches diminishing returns. Concurrently, the water cut may start to increase as the injected CO
2 fronts pass through the reservoir, eventually leading to breakthrough and the production of more water relative to oil. The intersection of rising water cut and the plateauing recovery factor is a critical point, indicating the need for potential adjustments in the injection strategy or the consideration of moving towards well abandonment. This trend provides operators with valuable information on the optimal duration and effectiveness of the CO
2 EOR process.
4. Conclusion and Recommendation
Table 6 show the Simulation Results of surfactant/Polymer, Hot water injection and CO
2 gas injection EOR
Table 6. Simulation Results.
| Surfactant/ Polymer EOR | Hot Water Injection EOR | CO2 Gas Injection EOR |
Cumulative Oil Produced (MMSTB) | 0.047815 | 0.0269035 | 0.0320068 |
Cumulative Water Produced (MMSTB) | 0.0611696 | 0.0056304 | 0.240873 |
Oil Recovery Factor (%) | 92.2909 | 62.4756 | 61.7785 |
4.1. Conclusions
4.1.1. Surfactant/Polymer EOR
Surfactant/Polymer (SP) flooding results in the highest cumulative oil production among the three methods, with 0.047815 MMSTB (million stock tank barrels). This superior performance is due to the effectiveness of surfactants in reducing interfacial tension, which mobilizes trapped oil, and the role of polymers in improving the sweep efficiency of the injected water. The significant oil production indicates that Surfactant/Polymer flooding is highly effective in enhancing oil recovery, particularly in this experiment.
The cumulative water production in SP flooding is 0.0611696 MMSTB, which is relatively high compared to the other methods. This increased water production is a trade-off for the high oil recovery, as the enhanced sweep efficiency can also lead to increased water cuts over time. This large quantity of water can be treated and reinjected back into the reservoir to continue the enhancement of the reservoir. SP flooding achieves an impressive oil recovery factor of 92.2909%, the highest among the three EOR methods. This high recovery factor reflects the method’s ability to mobilise a significant portion of the remaining oil in the reservoir, making it a highly effective EOR technique, as shown in
Table 6.
4.1.2. Hot Water Injection EOR
Hot Water Injection EOR produces 0.0269035 MMSTB of oil, which is the lowest among the three methods. The primary mechanism for oil recovery in this method is viscosity reduction, which is particularly effective in heavy oil reservoirs. However, its impact is less pronounced in light oil reservoirs, leading to lower cumulative oil production. While effective in specific reservoir conditions, hot water injection is less versatile compared to SP flooding and CO2 injection, resulting in lower overall oil recovery. This method has the lowest cumulative water production at 0.0056304 MMSTB. The low water production is advantageous in terms of operational costs and handling, but it also reflects the limited oil recovery efficiency compared to SP flooding. The oil recovery factor for hot water injection is 62.4756%, which is moderate. While effective in reducing oil viscosity and improving mobility, the method does not achieve the same level of oil recovery as SP flooding. However, it still offers a viable option in heavy oil reservoirs where other methods may not be as effective.
4.1.3. CO2 Gas Injection EOR
CO2 gas injection results in 0.0320068 MMSTB of cumulative oil production, which is higher than hot water injection but lower than SP flooding. CO2 injection works by reducing oil viscosity and swelling the oil, which enhances its mobility and recovery. The method is particularly effective in light to medium oil reservoirs where miscibility can be achieved. The cumulative oil production reflects the CO2 injection’s capability to mobilize oil that might otherwise remain trapped in the reservoir. With a cumulative water production of 0.240873 MMSTB, CO2 gas injection produces the highest amount of water among the three methods. This high water production can be a challenge in terms of water handling and disposal, potentially increasing operational costs. The oil recovery factor for CO2 gas injection is 61.7785%, which is comparable to hot water injection but significantly lower than SP flooding. The effectiveness of CO2 injection is highly dependent on reservoir conditions, particularly the ability to achieve miscibility. In suitable reservoirs, the recovery factor can be enhanced, but it remains less effective than SP flooding in this comparison.
4.1.4. Summary
Surfactant/Polymer EOR stands out with the highest cumulative oil production and oil recovery factor, making it the most effective method in this comparison. However, it also results in a relatively high cumulative water production.
Hot Water Injection EOR produces the least oil but also has the lowest cumulative water production, making it a cost-effective option in certain reservoirs, particularly those with heavy oil.
CO2 Gas Injection EOR offers a balance between oil production and recovery factor, with a higher cumulative oil production than hot water injection, but with a trade-off of higher water production. This method is effective in suitable reservoirs, especially where miscibility can be achieved.
4.2. Recommendation for the Most Effective EOR Method
Based on the comparison of Surfactant/Polymer EOR, Hot Water Injection EOR, and CO2 Gas Injection EOR, the Surfactant/Polymer EOR method emerges as the most effective Enhanced Oil Recovery (EOR) technique.
4.2.1. Factors to Consider in Recommendation
Highest Cumulative Oil Production: Surfactant/Polymer EOR produced 0.047815 MMSTB of oil, significantly outperforming the other methods. This indicates its superior ability to mobilize and recover oil, particularly in reservoirs where conventional methods may fall short.
Highest Oil Recovery Factor: With a recovery factor of 92.2909%, Surfactant/Polymer EOR demonstrates exceptional efficiency in extracting oil from the reservoir. This high recovery rate translates into a more complete utilization of the reservoir's potential, making it a highly effective option for maximizing production.
Trade-Off in Water Production: While Surfactant/Polymer EOR does result in higher cumulative water production, the increased oil recovery justifies this trade-off. Effective water management strategies can mitigate the challenges associated with higher water cuts.
4.2.2. Recommendation
For this experimental reservoir, where maximizing oil recovery is the primary objective, Surfactant/Polymer EOR is the recommended method. Its ability to significantly enhance oil production and achieve a high recovery factor makes it the most effective EOR technique in this context. However, it is essential to implement robust water handling and disposal strategies to manage the increased water production associated with this method.
Overall, Surfactant/Polymer EOR is the best choice for maximizing oil recovery and ensuring the most efficient use of reservoir resources.